This is a collection of my plots and their reproducible R scripts.
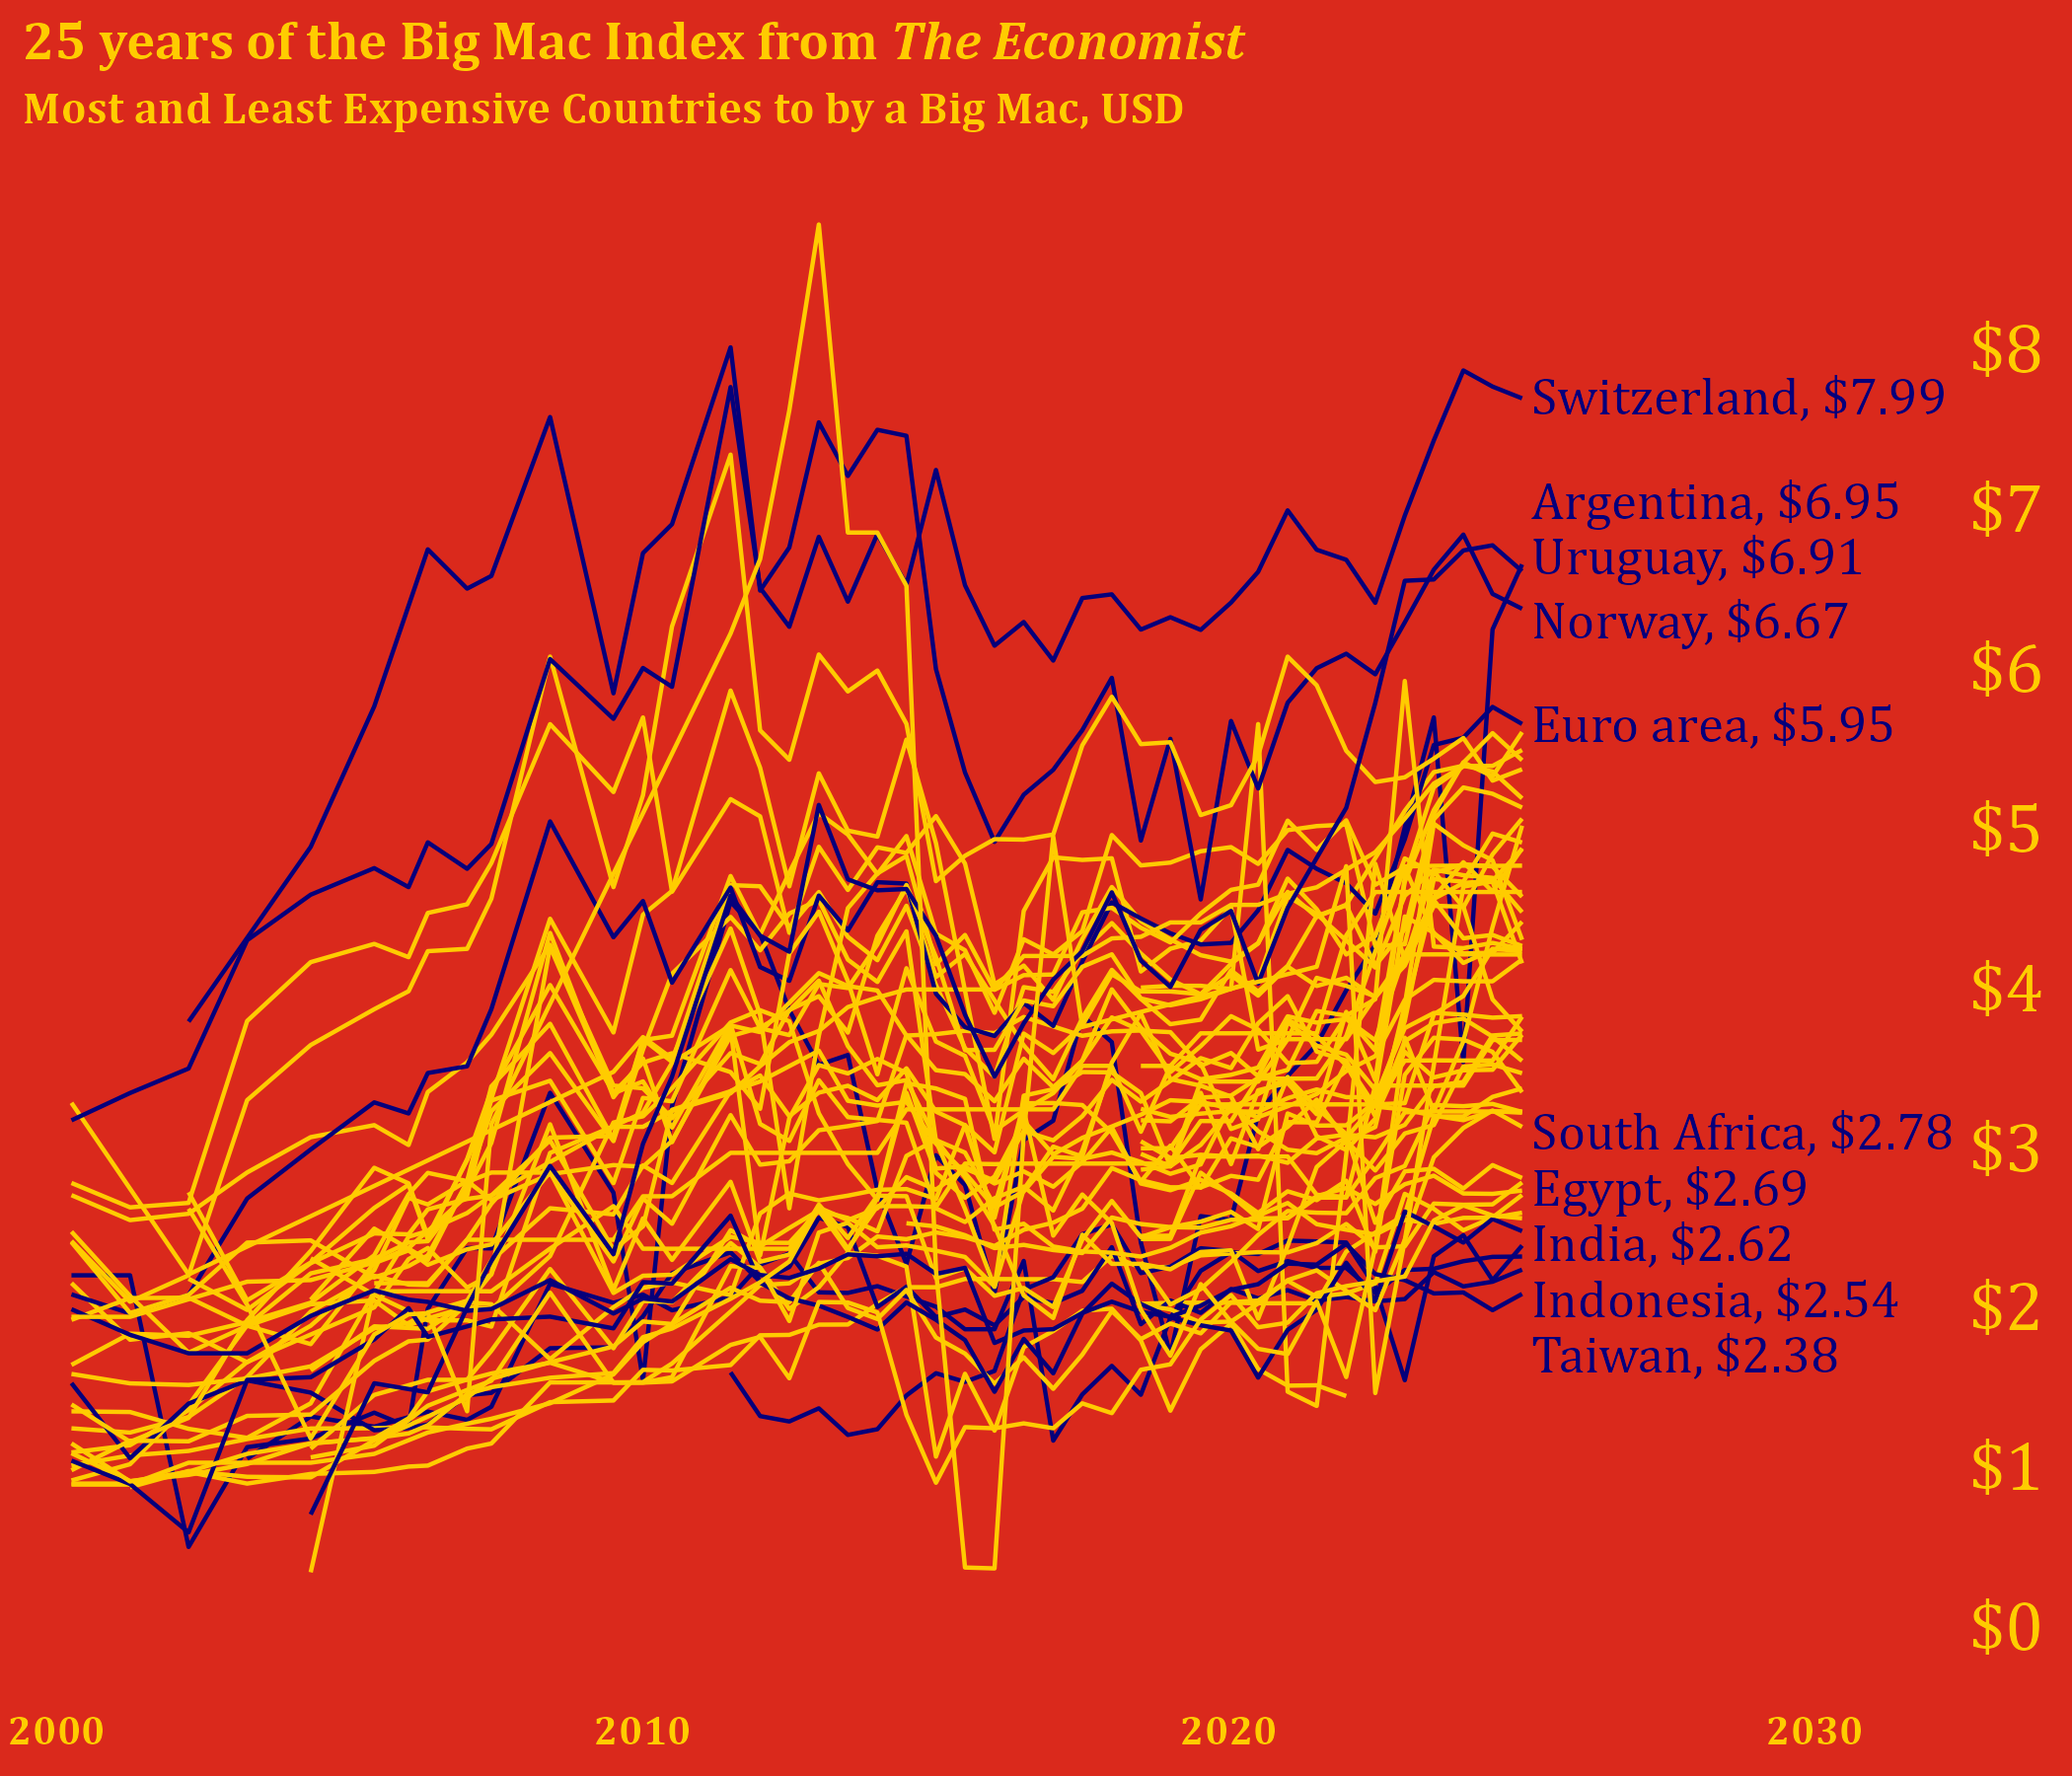
Visualizing global currency valuation through the lens of a hamburger
Let’s ask ClaudeAI to help us with identifying data stored in a string
A practice in plot animation
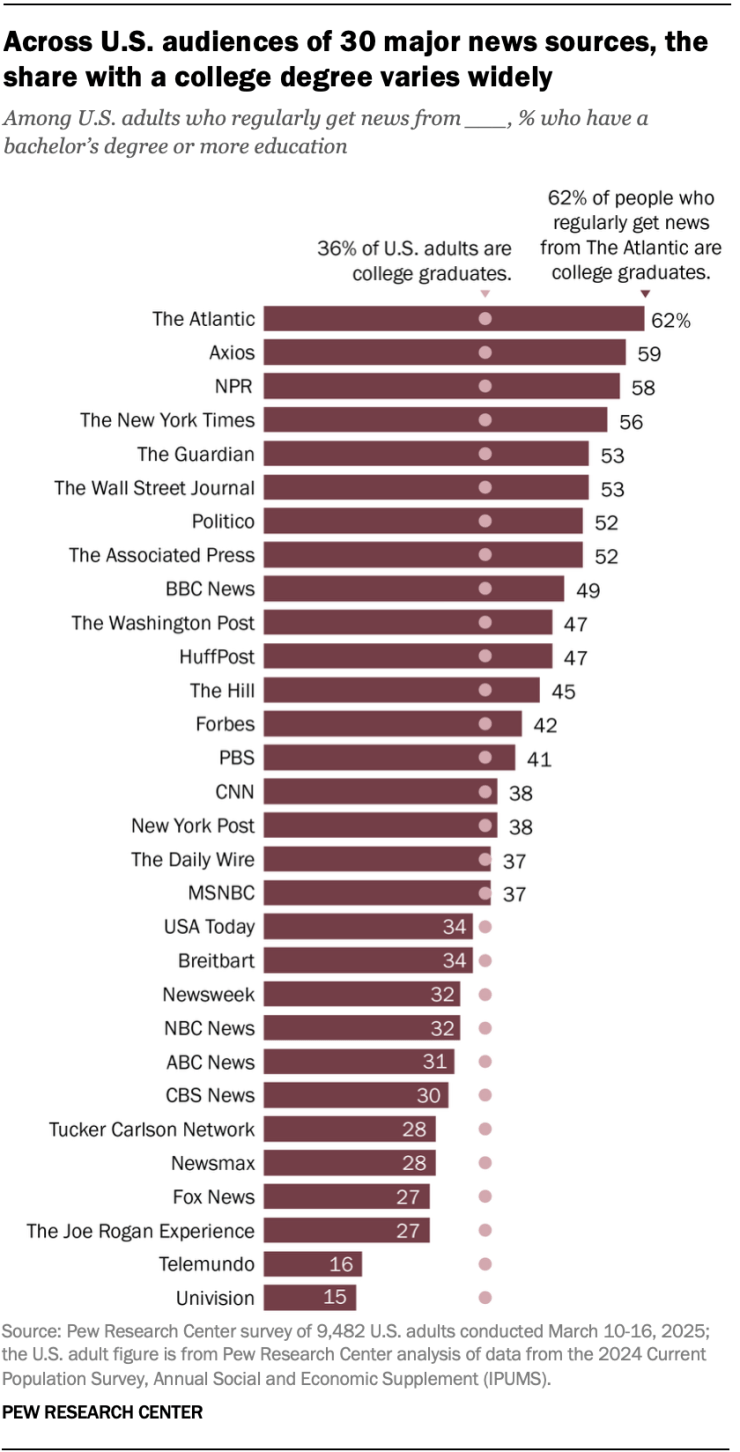
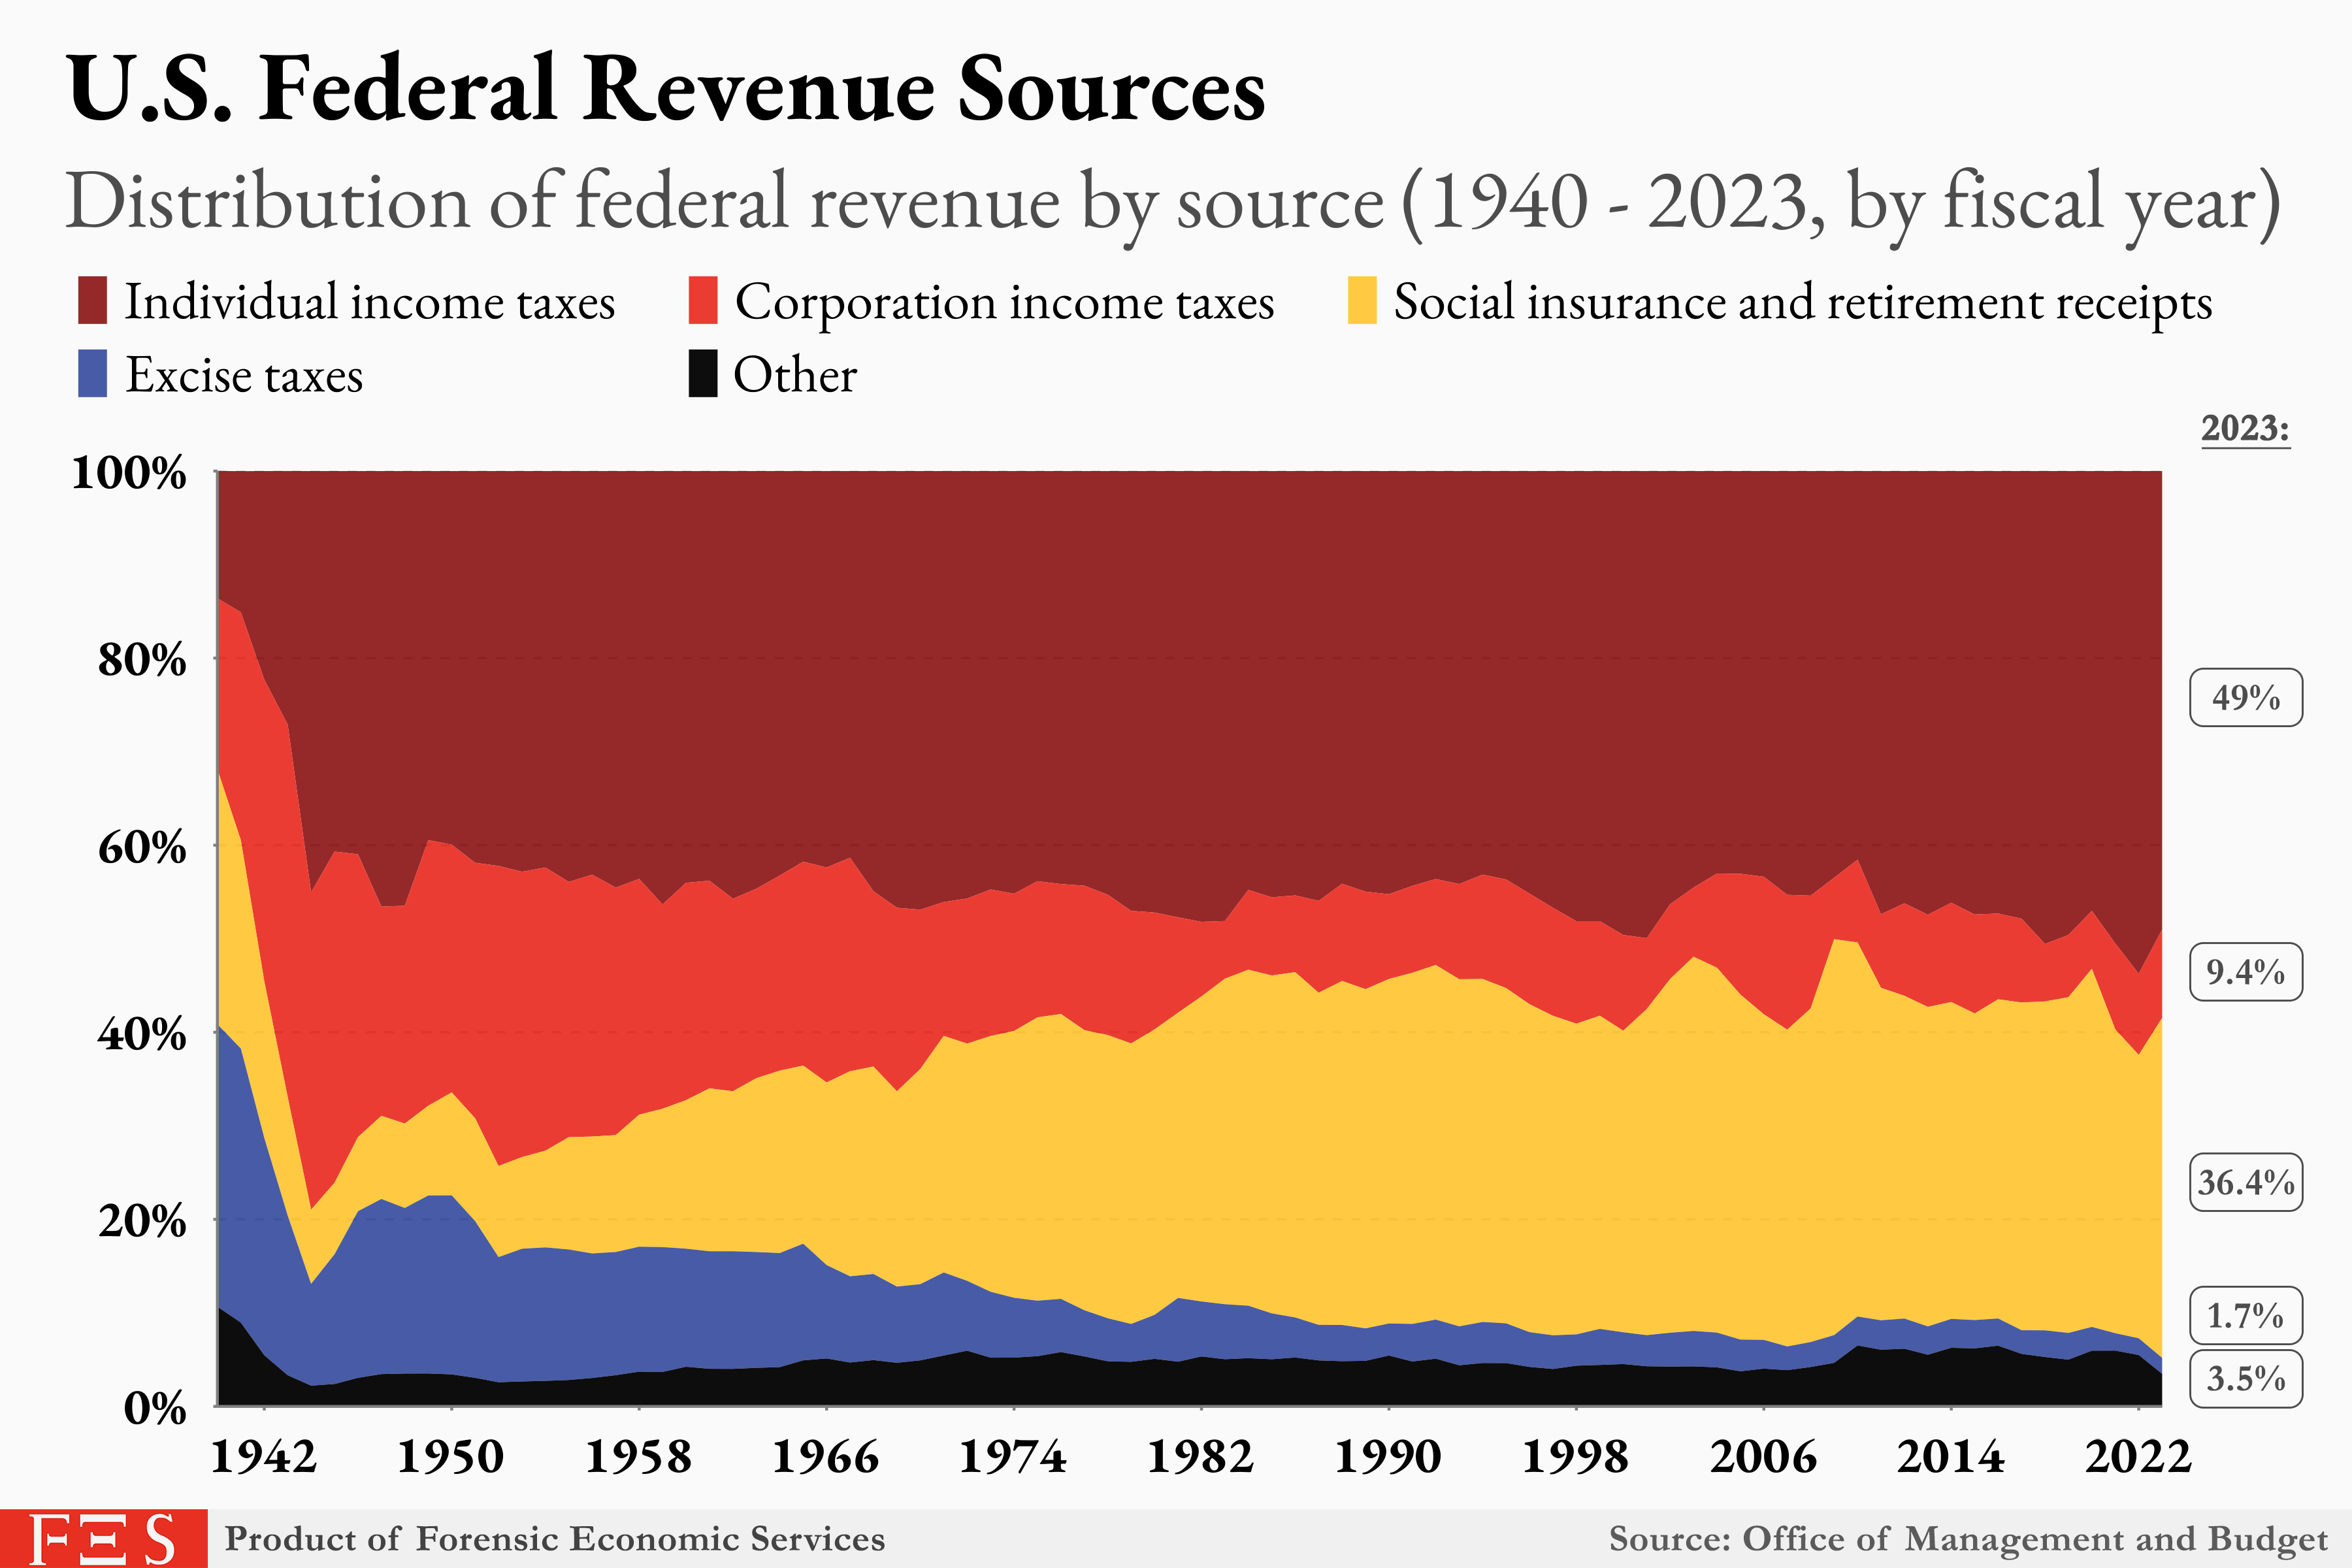
Figuring out how to reproduce a plot found out in the wild
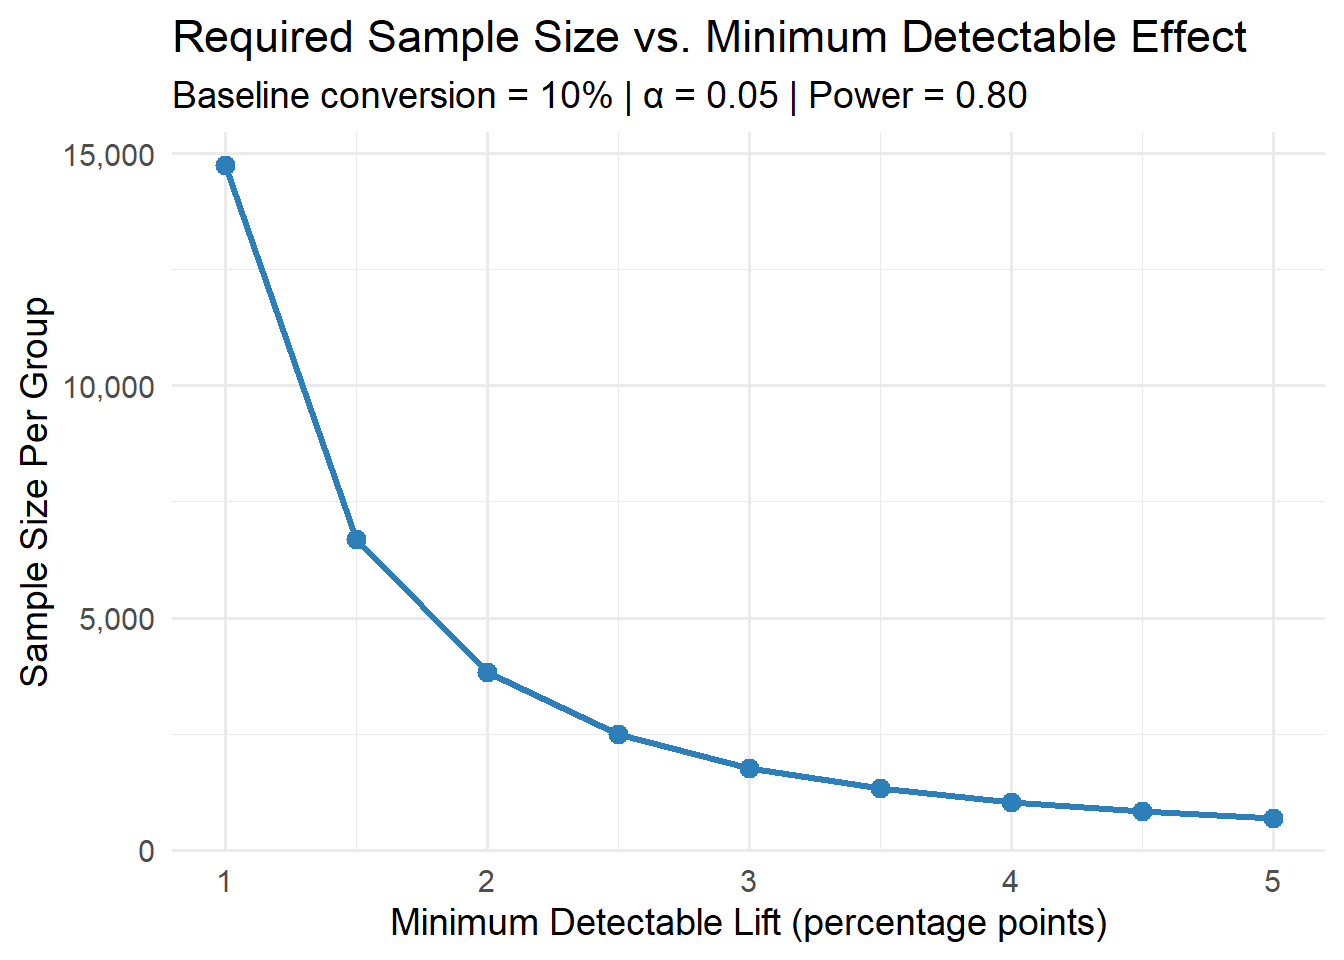
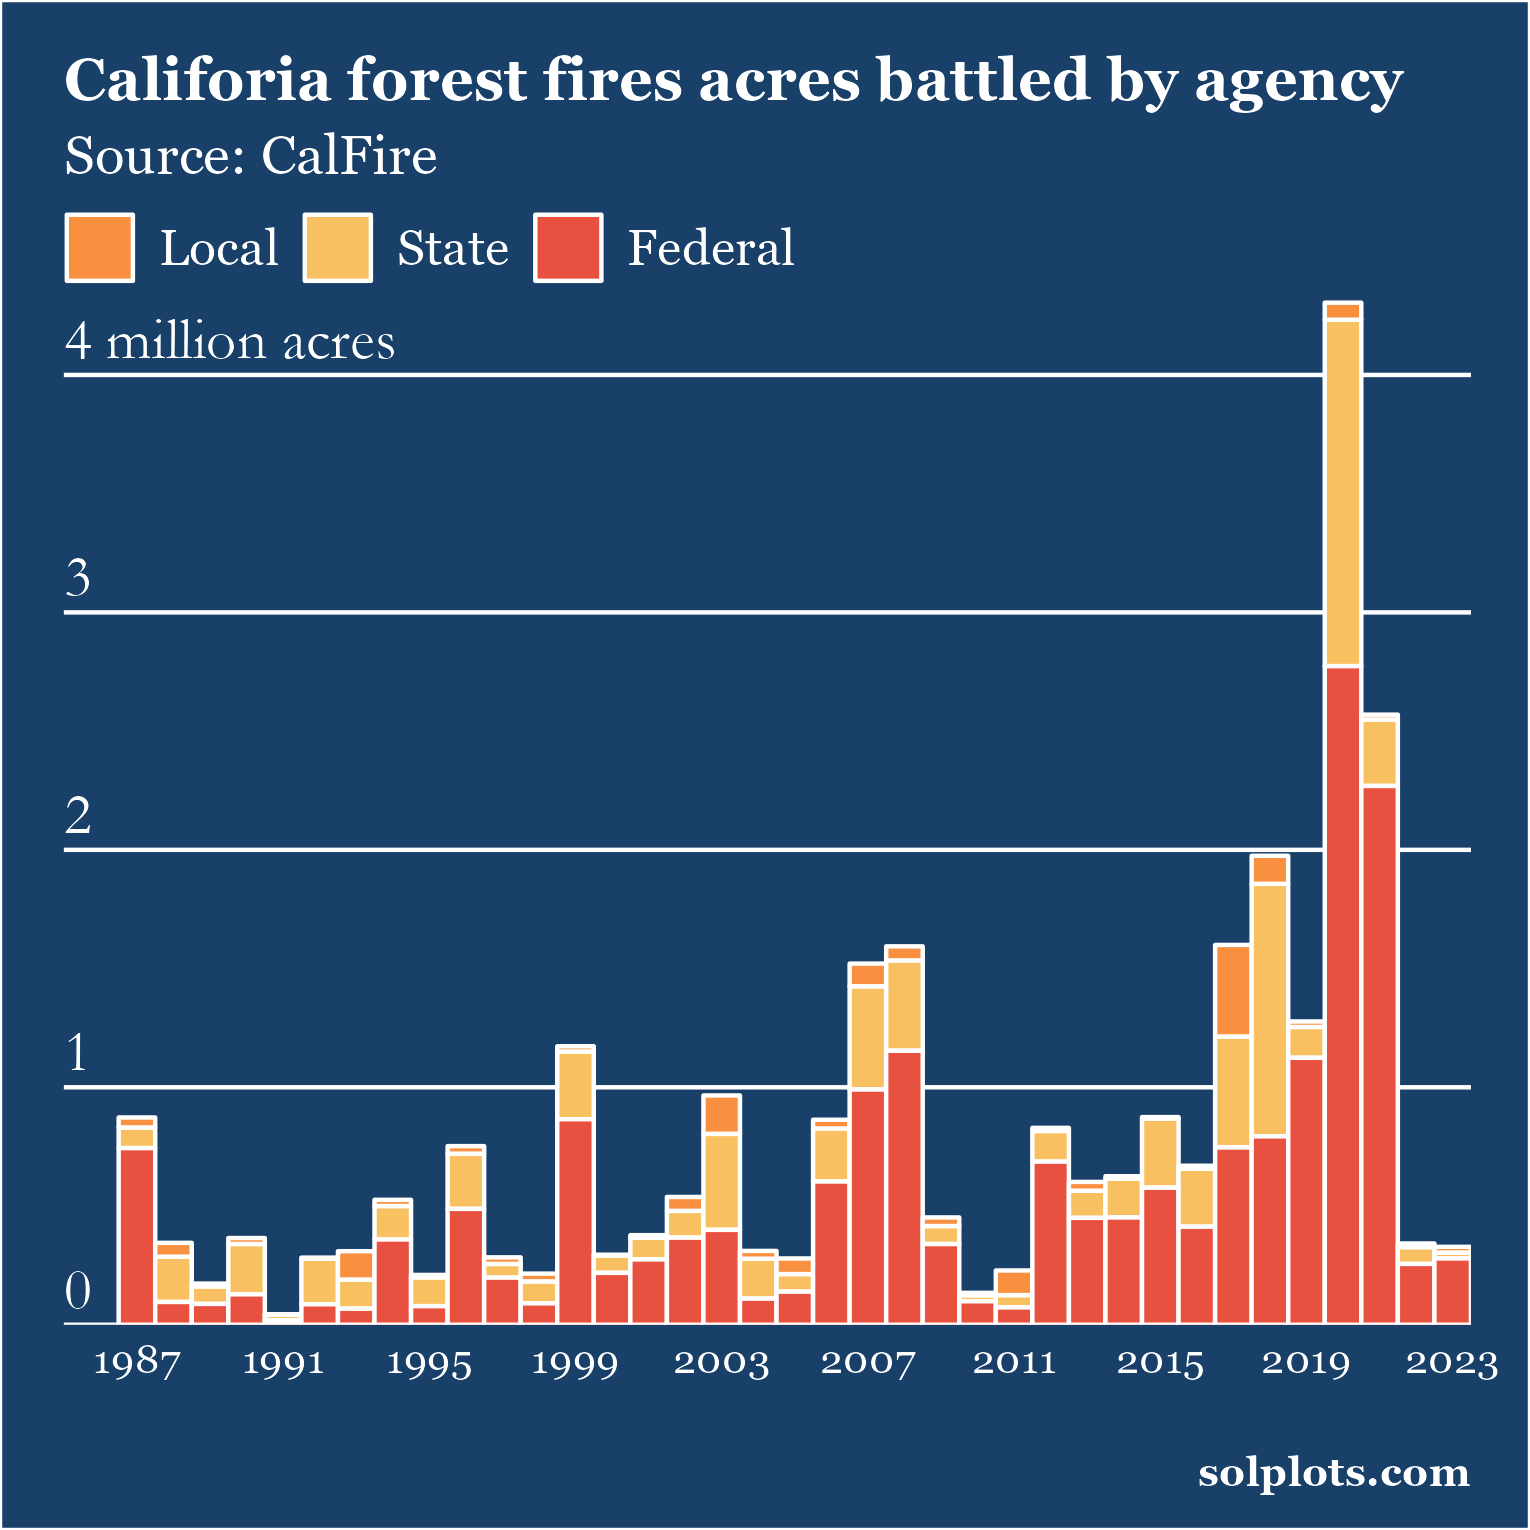
An exercise in effective use of color and axis labels
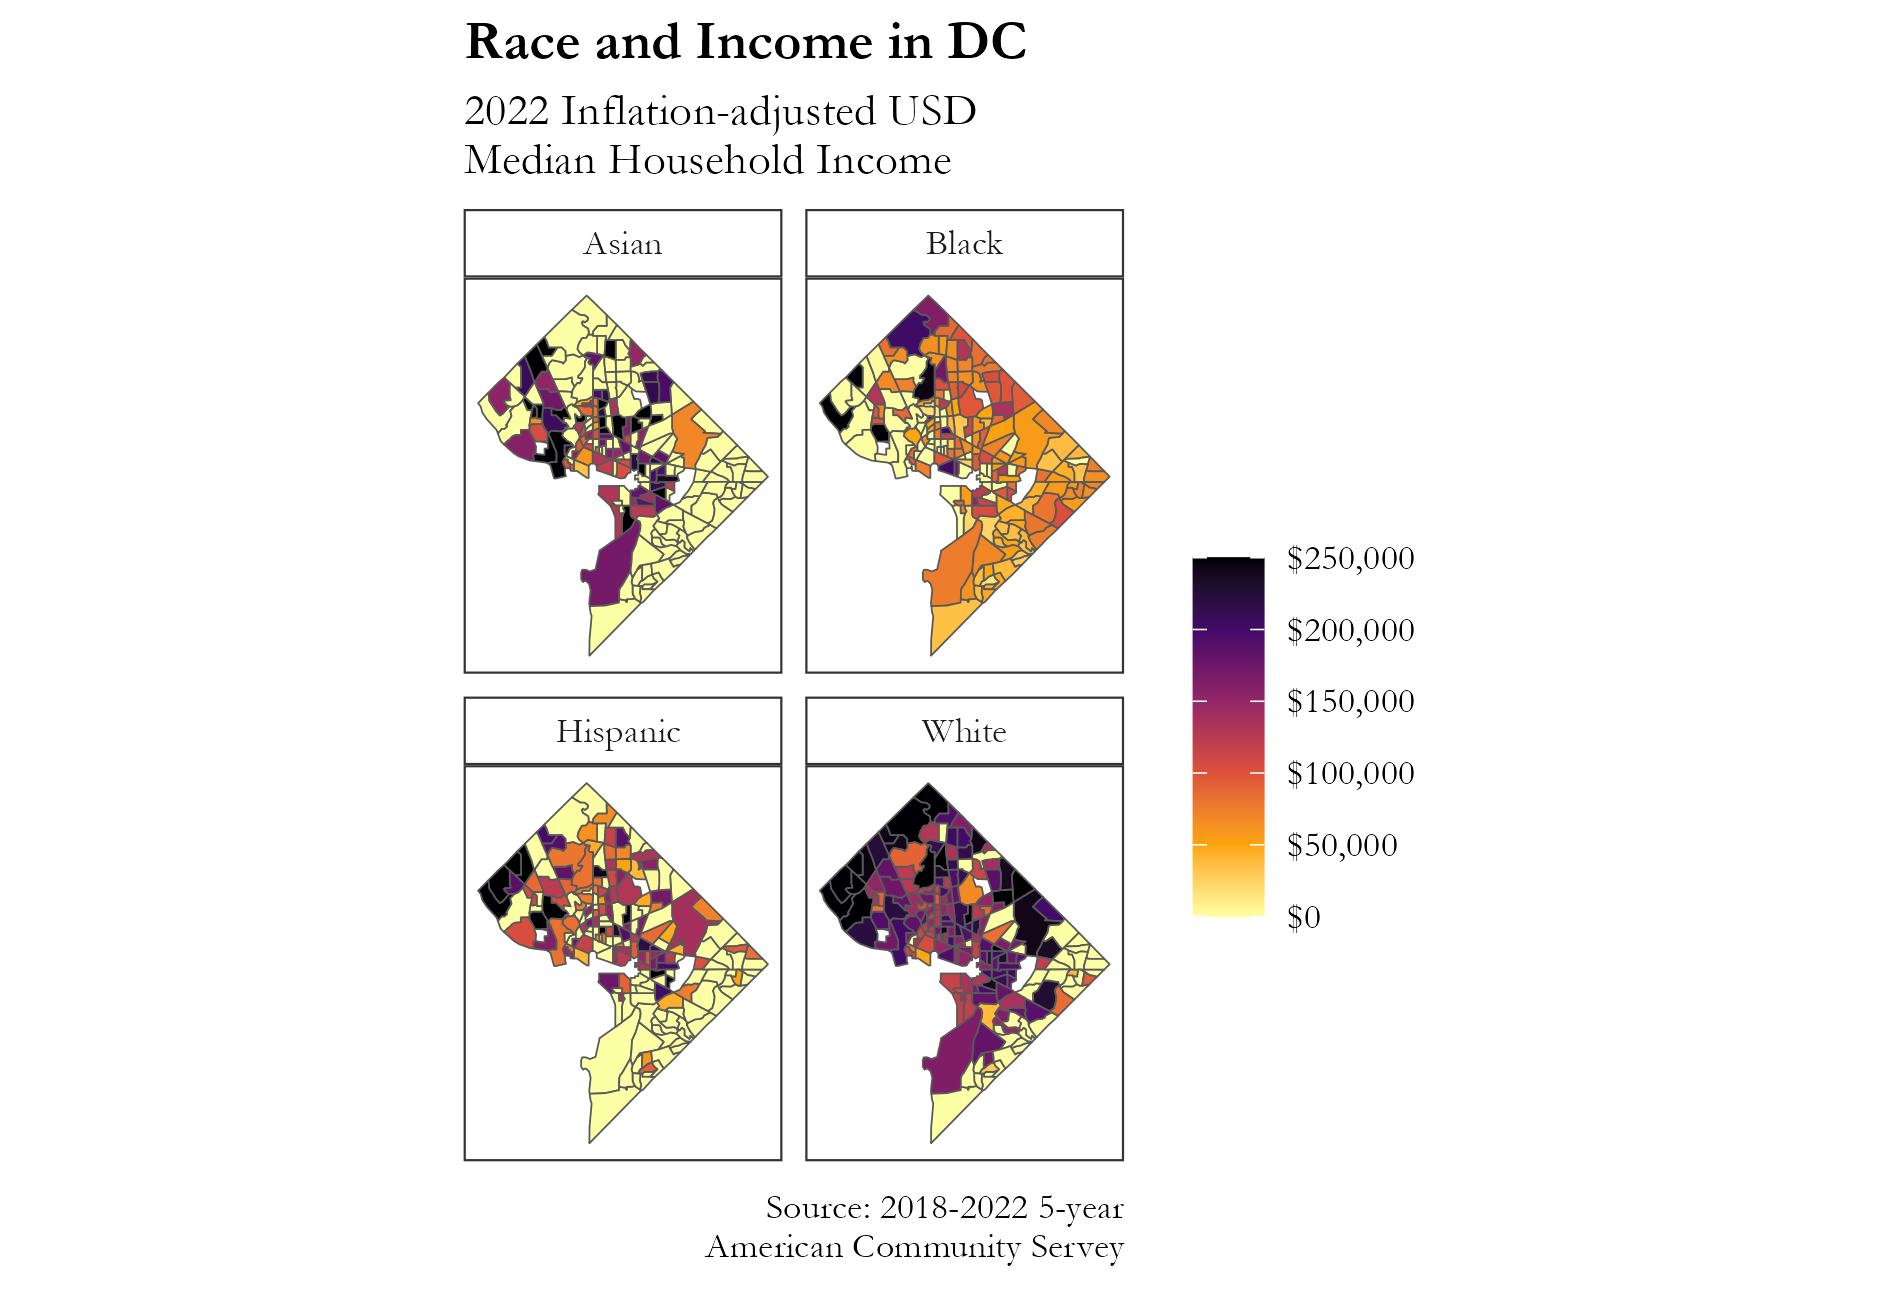
Mapping U.S. Census Data with R
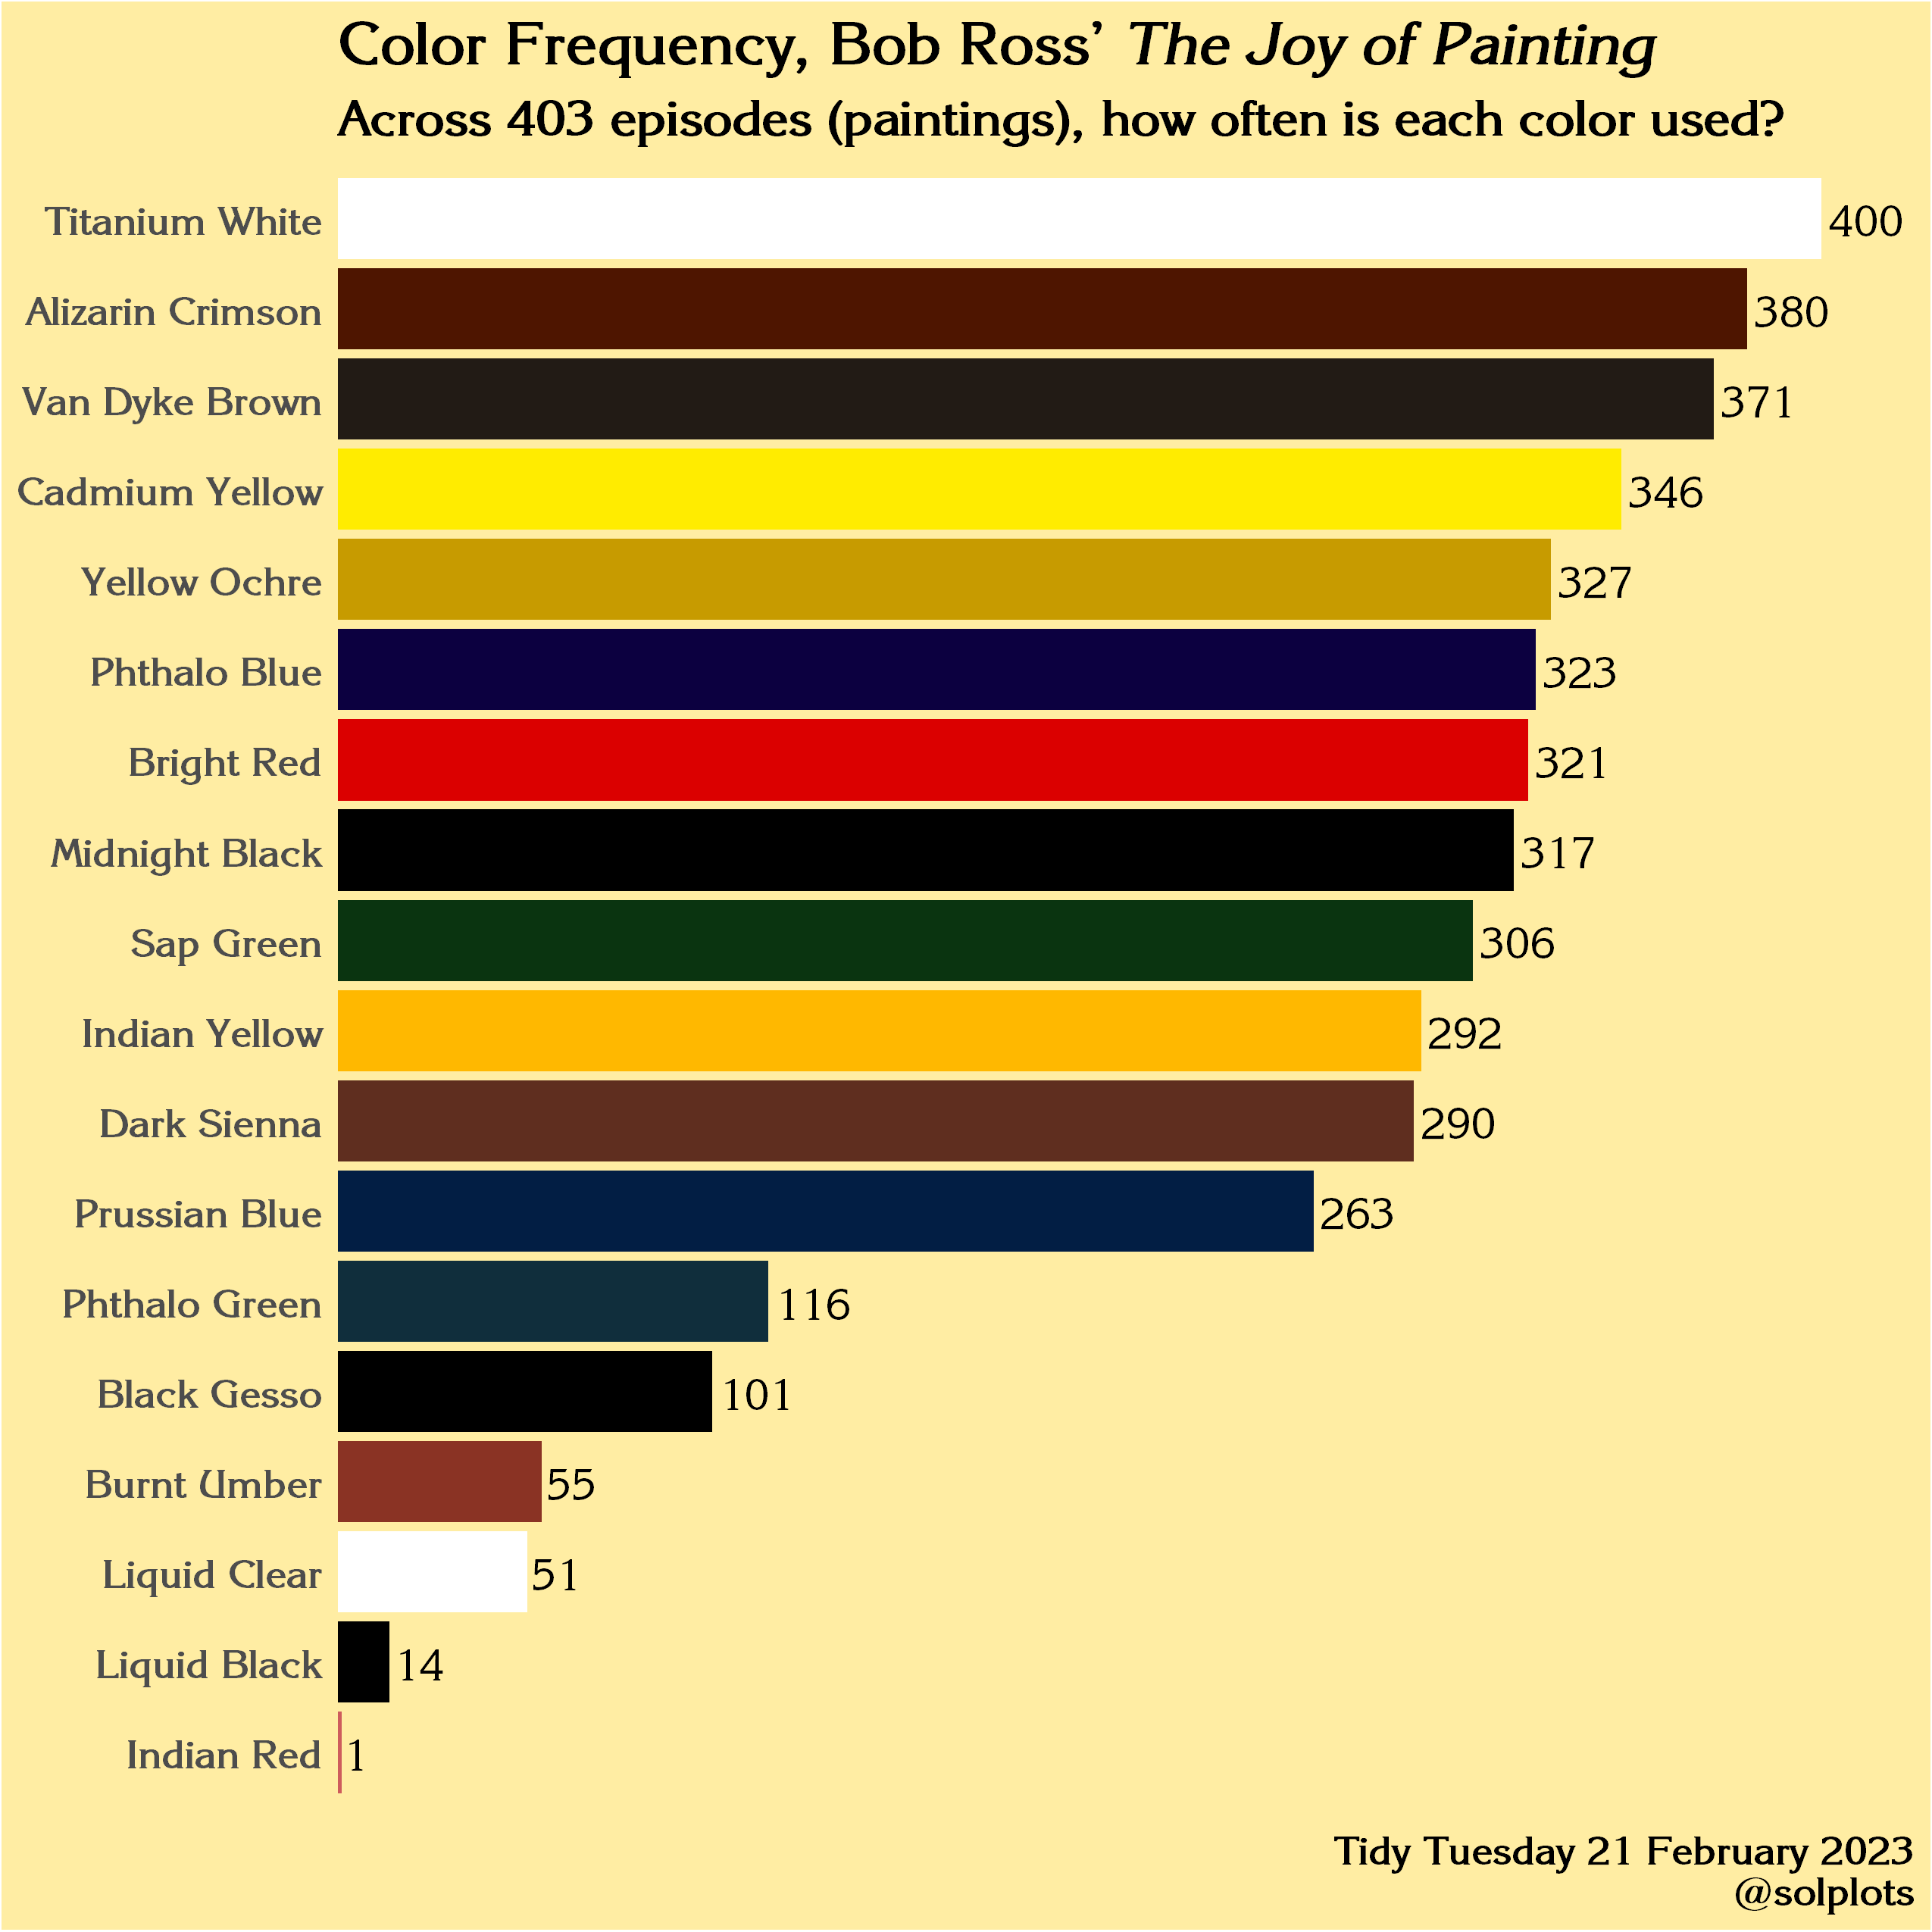
Submission to Tidy Tuesday for Week 8, 2023